Slow Heiken Ashi and Exponential Moving average Strategy 2.2Strategy using Slow Heiken Ashi by Glaz and Exponential moving averages. Looking for someone to help me turn the strategy into non-reoccuring alerts as I am having trouble doing so.
Cari dalam skrip untuk "Exponential Moving Average"
Holt Exponential Moving AverageHolt Exponential Moving Average indicator script.
This indicator was originally developed by Charles C. Holt (International Journal of Forecasting 20(1):5-10, March 2004: Forecasting seasonals and trends by exponentially weighted moving averages).

Multiple Exponential Moving AveragesThe "Multiple Exponential Moving Averages" indicator is a custom technical analysis tool created for TradingView. It combines five different Exponential Moving Averages (EMAs) into a single indicator. Each EMA has a user-defined length, and they are plotted on the chart with different colors to differentiate them.
Exponential Moving Averages are commonly used in technical analysis to smooth out price data and identify trends. They give more weight to recent price data, making them more responsive to recent price changes than Simple Moving Averages (SMAs). By combining multiple EMAs with different lengths, TradingView users will no longer have to worry that they will run out of slots when wanting to add new indicators to their chart.

[bjb] tEMAs - Triple Exponential Moving Averages, by BlueJayBirdIs it not a pain in the butt not to find a simple script like this one in TV? I didn't find one, so I made it.
Features:
- Simple script with 3 simple Exponential Moving Averages.
Special features:
- Settable time resolution.
- Colored fill between EMA20/50 pair, and between EMA50/200 pair.
More useful than you think:
- I've found it specially useful for detecting Elliot Wave patterns. The fill colors make them stand out. Use EMA20/50 pair for this.
- The resolution change makes EMAs studies from higher timeframes, at lower time frames, more accurate. Try from 1m timeframe, setting the tEMAs resolution to 1h.
Like, follow and comment. 💯

Nemesis: three exponential moving averages with two colorsEnglish: Three exponential moving averages with two colors. When the closing price is less than the average, the line will have a red color. You can change the averages and colors.
Português: Três médias móveis exponenciais (EMA) com duas cores. Quando o preço de fechamento é menor que a média, a linha terá uma cor vermelha. Você pode alterar as médias e cores.
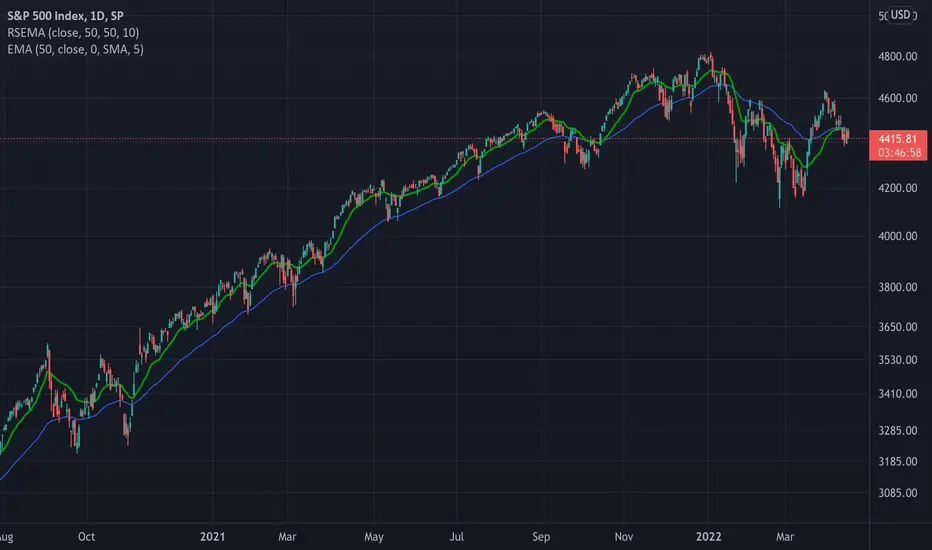
TASC 2022.05 Relative Strength Exponential Moving Average█ OVERVIEW
TASC's May 2022 edition Traders' Tips includes the "Relative Strength Moving Averages" article authored by Vitali Apirine. This is the code implementing the Relative Strength Exponential Moving Average (RS EMA) indicator introduced in this publication.
█ CONCEPTS
RS EMA is an adaptive trend-following indicator with reduced lag characteristics. By design, this was made possible by harnessing the relative strength of price. It operates in a similar fashion to a traditional EMA, but it has an improved response to price fluctuations. In a trading strategy, RS EMA can be used in conjunction with an EMA of the same length to identify the overall trend (see the preview chart). Alternatively, RS EMAs with different lengths can define turning points and filter price movements.
RS EMA is an adaptive trend-following indicator with reduced lag characteristics. By design, this was made possible by harnessing the relative strength of price. It operates in a similar fashion to a traditional EMA, but it has an improved response to price fluctuations.
█ CALCULATIONS
The following steps are used in the calculation process:
• Calculate the relative strength (RS) of a given length.
• Multiply RS by a chosen coefficient (multiplier) to adapt the EMA filtering the original time series. Calculate the EMA of the resulting time series.
The author recommends RS EMA(10,10,10) as typical settings, where the first parameter is the EMA length, the second parameter is the RS length, and the third parameter is the RS multiplier. Other values may be substituted depending on your trading style and goals.
Scripting Tutorial 2 - Triple Exponential Moving AveragesThis script is for a triple exponential moving average indicator. It is meant as an educational script with well formatted styling, and references for specific functions.
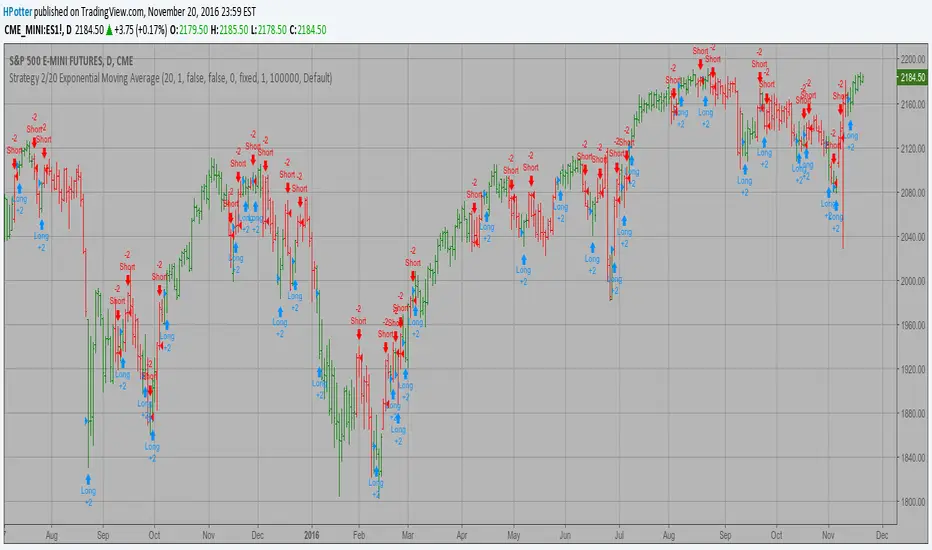
2/20 Exponential Moving Average Backtest Strategy
This indicator plots 2/20 exponential moving average. For the Mov
Avg X 2/20 Indicator, the EMA bar will be painted when the Alert criteria is met.
You can use in the xPrice any series: Open, High, Low, Close, HL2, HLC3, OHLC4 and ect...
You can change long to short in the Input Settings
Please, use it only for learning or paper trading. Do not for real trading.

Zero Lag Exponential Moving Average ForLoop [InvestorUnknown]Overview
The Zero Lag Exponential Moving Average (ZLEMA) ForLoop indicator is designed for traders seeking a responsive and adaptive tool to identify trend changes. By leveraging a range of lengths and different moving average (MA) types, this indicator helps smooth out price data and provides timely signals for market entry and exit.
User Inputs
Start and End Lengths: Define the range of lengths over which the IIRF values are calculated.
Moving Average Type: Choose from EMA, SMA, WMA, VWMA, or TMA for trend smoothing.
Moving Average Length: Specify the length for the chosen MA type.
Calculation Source: Select the price data used for calculations.
Signal Calculation
Signal Mode (sigmode): Determines the type of signal generated by the indicator. Options are "Fast", "Slow", "Thresholds Crossing", and "Fast Threshold".
1. Slow: is a simple crossing of the midline (0).
2. Fast: positive signal depends if the current MA > MA or MA is above 0.99, negative signals comes if MA < MA or MA is below -0.99.
3. Thresholds Crossing: simple ta.crossover and ta.crossunder of the user defined threshold for Long and Short.
4. Fast Threshold: signal changes if the value of MA changes by more than user defined threshold against the current signal
col1 = MA > 0 ? colup : coldn
var color col2 = na
if MA > MA or MA > 0.99
col2 := colup
if MA < MA or MA < -0.99
col2 := coldn
var color col3 = na
if ta.crossover(MA,longth)
col3 := colup
if ta.crossunder(MA,shortth)
col3 := coldn
var color col4 = na
if (MA > MA + fastth)
col4 := colup
if (MA < MA - fastth)
col4 := coldn
color col = switch sigmode
"Slow" => col1
"Fast" => col2
"Thresholds Crossing" => col3
"Fast Threshold" => col4
Visualization Settings
Bull Color (colup): The color used to indicate bullish signals.
Bear Color (coldn): The color used to indicate bearish signals.
Color Bars (barcol): Option to color the bars based on the signal.
Custom function
// Function to calculate an array of ZLEMA values over a range of lengths
ZLEMAForLoop(a, b, c, s) =>
// Initialize an array to hold ZLEMA trend values
var Array = array.new_float(b - a + 1, 0.0)
// Loop through the range from 'a' to 'b'
for x = 0 to (b - a)
// Calculate the current length
len = a + x
// Calculate the lag based on the length
lag = math.floor((len - 1) / 2)
// Calculate the smoothing factor alpha
alpha = 2 / (len + 1)
// Initialize the ZLEMA variable
zlema = 0.0
// Compute the ZLEMA value
zlema := na(zlema ) ? (s + s - s ) : alpha * (s + s - s ) + (1 - alpha) * nz(zlema )
// Determine the trend based on ZLEMA value
trend = zlema > zlema ? 1 : -1
// Store the trend in the array
array.set(Array, x, trend)
// Calculate the average of the trend values
Avg = array.avg(Array)
// Apply the selected moving average type to the average trend value
float MA = switch maType
"EMA" => ta.ema(Avg, c) // Exponential Moving Average
"SMA" => ta.sma(Avg, c) // Simple Moving Average
"WMA" => ta.wma(Avg, c) // Weighted Moving Average
"VWMA" => ta.vwma(Avg, c) // Volume-Weighted Moving Average
"TMA" => ta.trima(Avg, c) // Triangular Moving Average
=>
runtime.error("No matching MA type found.") // Error handling for unsupported MA type
float(na)
// Return the array of trends, the average trend, and the moving average
Important Considerations
Speed vs. Stability: The ZLEMA ForLoop is designed for fast response times, making it ideal for short-term trading strategies. However, its sensitivity also means it may generate more signals, some of which could be false positives.
Use with Other Indicators: To improve the reliability of the signals, it is recommended to use the ZLEMA ForLoop in conjunction with other technical indicators.
Customization: Tailor the settings to match your trading style and risk tolerance. Adjusting the lengths, MA type, and thresholds can significantly impact the indicator's performance.
Conclusion
The ZLEMA ForLoop indicator offers a flexible tool for traders looking to capture trend changes quickly. By providing multiple modes and customization options, it allows traders to fine-tune their analysis and make informed decisions. For best results, use this indicator alongside other analytical tools to confirm signals and avoid potential false entries.

Cumulative Weighted Exponential Moving Average (CWEMA)This is a Pine Script for the "Cumulative Weighted Exponential Moving Average" (CWEMA) indicator. The script defines the CWEMA indicator using the ema() and wma() functions, which respectively calculate the exponential moving average and weighted moving average of a given data series. The cwema() function computes the weights for each value in the moving average and then uses the wma() function to calculate the weighted moving average of the exponentially weighted moving average of the input data series. The resulting CWEMA values are plotted on a chart.

Multi Poles Zero-Lag Exponential Moving AverageIntroduction
Based on the exponential averaging method with lag reduction, this filter allow for smoother results thanks to a multi-poles approach. Translated and modified from the Non-Linear Kalman Filter from Mladen Rakic 01/07/19 www.mql5.com
The Indicator
length control the amount of smoothing, the poles can be from 1 to 3, higher values create smoother results.
Difference With Classic Exponential Smoothing
A classic 1 depth recursion (Single smoothing) exponential moving average is defined as y = αx + (1 - α)y which can be derived into y = y + α(x - y )
2 depth recursion (Double smoothing) exponential moving average sum y with b in order to reduce the error with x , this method is calculated as follow :
y = αx + (1 - α)(y + b)
b = β(y - y ) + (1-β)b
The initial value for y is x while its 0 for b with α generally equal to 2/(length + 1)
The filter use a different approach, from the estimation of α/β/γ to the filter construction.The formula is similar to the one used in the double exponential smoothing method with a difference in y and b
y = αx + (1 - α)y
d = x - y
b = (1-β)b + d
output = y + b
instead of updating y with b the two components are directly added in a separated variable. Poles help the transition band of the frequency response to get closer to the cutoff point, the cutoff of an exponential moving average is defined as :
Cf = F/2π acos(1 - α*α/(2(1 - α)))
Also in order to minimize the overshoot of the filter a correction has been added to the output now being output = y + 1/poles * b
While this information is far being helpful to you it simply say that poles help you filter a great amount of noise thus removing irregularities of the filter.
Conclusion
The filter is interesting and while being similar to multi-depth recursion smoothing allow for more varied results thanks to its 3 poles.
Feel free to send suggestions :)
Thanks for reading
Meister Shredder - Exponential Moving Averages x4 ForecastShows the 21, 50, 100, 200 Exponential Moving Average + 6 bar forecast

2/20 Exponential Moving Average StrategyThis indicator plots 2/20 exponential moving average. For the Mov
Avg X 2/20 Indicator, the EMA bar will be painted when the Alert criteria is met.
Please, use it only for learning or paper trading. Do not for real trading.
Hull Weighted Exponential Moving AverageBINANCE:BTCUSDT
Open source version of the Hull Weighted Exponential Moving Average as described by Vincent Charles in [ Hull-WEMA: A Novel Zero-Lag Approach in the Moving Average Family ]
█ OVERVIEW
The study takes into considerations two variants of MA.
Namely:
Weighted Exponential Moving Average (WEMA)
Hull Moving Average (HMA)
WEMA, which was introduced in 2013, has been widely used in different scenarios but still suffers from lags.
To address this shortcoming, a novel zero-lag Hull-WEMA method is proposed that combines HMA and WEMA.
Results show that the new approach achieves a better accuracy level than both HMA and WEMA.
█ SIGNALS
The indicator generates:
a LONG signal when switching color from RED to GREEN
a SHORT signal when switching color from GREEN to RED
Additionally is available an option to color the candles on your chart to confirm the signals and filter ranges.

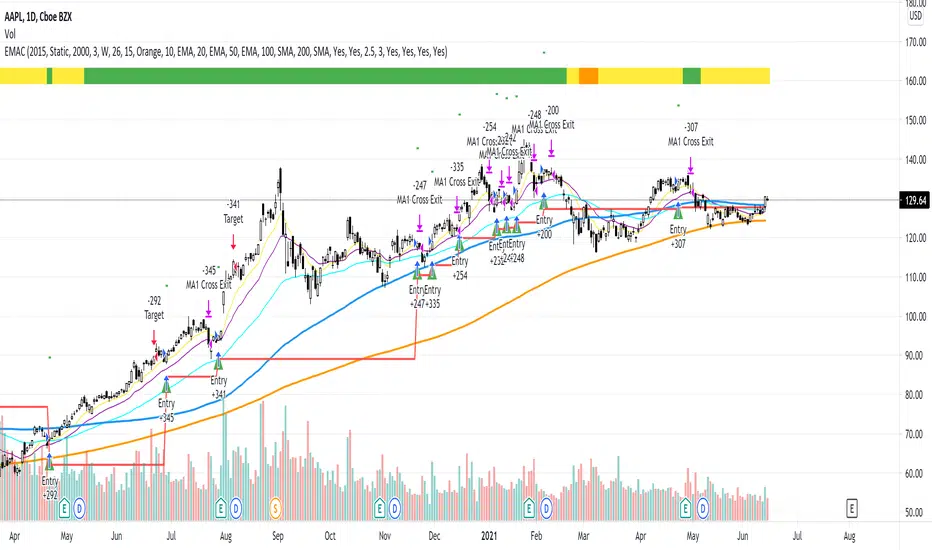
EMAC - Exponential Moving Average Cross - StudyEMAC - Exponential Moving Average Cross - Study
This is the short Study version of EMAC that has been optimized for TradersPost alerts only
For the original full Strategy version with many editable inputs please see EMAC - Exponential Moving Average Cross
For the full Strategy version with the best currently known optimized inputs (average best settings across 26 tickers) please see EMAC - Exponential Moving Average Cross - Optimized

EMAC - Exponential Moving Average Cross - OptimizedEMAC - Exponential Moving Average Cross - Optimized
This is the full Strategy version with the best currently known optimized inputs with the average best settings across the following 26 tickers:
QQQ
TQQQ
SPY
SPXL
AAPL
AMZN
TSLA
BYND
CRWD
DDOG
ESTC
FSLY
MDB
NVDA
PINS
PTON
ROKU
SHOP
SQ
TDOC
TWLO
APPS
CHWY
DKNG
ETSY
FVRR
For the short Study version of EMAC that has been optimized for TradersPost alerts only please see EMAC - Exponential Moving Average Cross - Study
For the original full Strategy version with many editable inputs please see EMAC - Exponential Moving Average Cross

EMAC - Exponential Moving Average CrossEMAC - Exponential Moving Average Cross
This strategy is based in part on original 10ema Basic Swing Trade Strategy by Matt Delong: www.tradingview.com
Link to original 10ema Basic Swing Trade Strategy:
This is the Original EMAC - Exponential Moving Average Cross strategy built as a class for reallifetrading dot com and so has all the default settings and has not been optimized. I would not recommend using this strategy with the default settings and is for educational purposes only. For the fully optimized version please come back around the same time tomorrow 6/16/21 for the EMAC - Exponential Moving Average Cross - Optimized
If you have any questions feel free to reach out to me with a comment and I will try to get back to you quickly with a reply.
Zero Lag Exponential Moving Average (ZLEMA) The Zero lag exponential moving average (ZLEMA) indicator was created
by John Ehlers and Ric Way.
As is the case with the Double exponential moving average (DEMA) and
the Triple exponential moving average (TEMA) and as indicated by the
name, the aim is to eliminate the inherent lag associated to all trend
following indicators which average a price over time.

Moving Average Exponential (Daily Frozen EMA)This script plots an Exponential Moving Average (EMA) based on the daily timeframe, but with a unique twist:
✅ The EMA value is frozen for the entire current daily session, only updating when a new daily candle begins.
🔍 How it works:
The EMA is calculated using the 1-day timeframe, regardless of the chart's current timeframe.
This EMA value remains fixed throughout the day — it doesn't fluctuate intrabar.
It updates only once the daily candle has closed, providing a stable and reliable reference point during the trading day.
The default is the 5 day EMA but can be changed to any EMA timeframe you desire such as 9, 21, 50, 100. 200, etc.
✨ Additional Features:
✅ Optional smoothing with various moving average types (SMA, EMA, WMA, SMMA, VWMA).
✅ Optional Bollinger Bands on top of the smoothed EMA.
✅ Adjustable settings for EMA length, smoothing type, Bollinger Band deviation, and display options.
🛠️ Use Cases:
Ideal for traders who want a non-reactive EMA during intraday trading.
Helps reduce signal noise by anchoring EMA to higher timeframe structure.
Useful for strategy development where EMA should represent confirmed daily bias only.
Hope this helps, happy trading!

Two Exponential Moving Average CrossUsed to track up and down trends by crossing two 9- and 72-period exponential moving averages

MTF EMA 3Set(Multi Time Frame Exponential Moving Averages 3 Set)Multi Time Frame Exponential Moving Averages 3 Set
One indicator displays the three types of moving averages of the top bar.
It can be used for environment recognition.
It is easy to repel when the 4 hour foot and the pivot overlap.
Elder impulse system with double exponential moving average dema
This version of impulse uses the double exponential moving average instead of the typical ema both to calculate macd and the moving slow and fast moving average that are plotted.
The impulse system :
The Impulse System combines two simple but powerful indicators.
One measures market inertia, the other its momentum. When both
point in the same direction, they identify an impulse worth following.
We get an entry signal when both indicators get in gear.
The Impulse System uses an exponential moving average to find
uptrends and downtrends. When the EMA rises, it shows that inertia
favors the bulls. When EMA falls, inertia works for the bears. The sec-
ond component is MACD-Histogram, an oscillator whose slope reflects
changes of power among bulls or bears. When MACD-Histogram rises,
it shows that bulls are becoming stronger. When it falls, it shows that
bears are growing stronger.
The Impulse System flags those bars where both the inertia and the
momentum point in the same direction. When both the EMA and
MACD-Histogram rise, they show that bulls are roaring and the uptrend
is accelerating.